
I haven’t used python before, although it is pretty prevalent in the data science community. I did some research on some machine learning classes, and found one was specifically known as having a (long) introduction to python – so this is the course I happily signed up for. The course was cheap; I’m still doing it, and enjoying it thus far – Python for Data Science and Machine Learning Bootcamp.
I’m using an Anaconda environment on Win10 and overall enjoying the Jupyter Notebook format. Things became more interesting in my homework at the point I was given a bunch of visualization exercises; as these happened to line up pretty well with the first Data Science for Good: Kiva Crowdfunding kernel competition. The prize structure can be seen here. There were 3 types;
- Most used datasets added to Kaggle
- Most upvoted kernels
- Works chosen by the Kiva team
This is a bit different than the typical Kaggle competition, which involves some kind of model to predict or classify data. Often rewarded for being the most accurate/hypertuned to fit the data set; arguably perhaps even overfit? This is a pretty different type of contest, where the effort is to find the most interesting and illuminating data and models to enrich and complement what Kiva is already doing. Kiva themselves hinted at what kind of model they’d really like, with the Stanford prediction of consumption via maps.
This competition was a good fit for me; most of the work was of the Exploratory Data Analysis (EDA) type when I joined, about a month after the competition started. Essentially everyone was doing exercises similar to my homework – just visualizing the data in various ways. This was a great fit for me not only because it was similar to my homework, but because I was a Kiva lender. Not only that, I am a bit of an armchair economist, so this is a topic I am interested in and really enjoyed researching and visualizing the data.
I was surprised to see not a lot of modeling was actually going on. It was also interesting to see how the crowd approached the problem and their work contributions; usually Kaggle has a very defined problem, and much effort is simply tuning the model. This problem was a lot more open and takes a different kind of creativity to look at, as well as exploring some of the soft science of economics as well as deciding what information might be valuable and how to use it. As well as applying visualization techniques, something not typically necessary in the standard algo competition.
I was surprised to see that not much modeling was being done at one point; virtually everything was EDA based. I started getting some hope that I might be able to not just practice but actually place in the competition, as I thought my work was pretty good and had some unique elements to it. I also did not know how to model – which wasn’t going to hurt me too bad if no one else was actually modeling! Kiva did release some guidelines about what it would take to win their primary prize track (3) at one point, of what they were really looking for. I thought this was good and necessary as a lot of the work didn’t seem to be very actionable up until that point. They also held a good Ask Me Anything (AMA) session – which was a good place to consolidate questions for them to answer, which otherwise had been a little spotty.
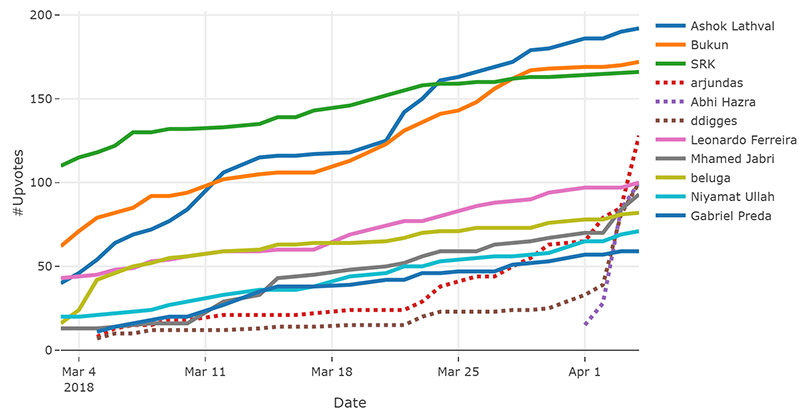
User Beluga created a cool little kernel to track leaderboard progress for the upvoted kernels. I was floating around up there, but not enough to place for a prize, although I thought my work was within that territory. Some interesting lessons learned for this part of the competition;
- You’re at an advantage for this type of competition if you have an established and followed account. basically you have a lot of friends available who can provide you some of those much needed votes.
- You’ll also want to get in early and often in this type of competition. you’ll have the most eyeballs on your work and least amount of competition for a thumbs up at this stage; if you’re the first to publish, everyone will see your stuff. you’ll also get some kudos for providing some helpful starter ideas for others to launch off of. certainly first starting off, it was helpful to see what others had done, both with code and basic ideas, to then branch out into my own more creative work.
- This is also a bit of a popularity contest as well. i tried to review some other people’s work and make some suggestions here and there for things i thought could be improved, or point out some of the things i liked that showed up in some other people’s more creative and unique work or cool findings.
The first round of reward winners for most popular datasets and most upvoted kernels were announced here. Part of the role of these awards was to incentivize community contribution and sharing of data and ideas. After this I felt like the general momentum of the competition slowed a bit, although plenty of work was still being done. It is simply easier to try and visualize things and go for votes than to produce some kind of model with more actionable use of the data. Although the general momentum slowed, particularly near the end there was the emergence of more modeling attempts to predict poverty or financial exclusion in a region where data was sparse or dirty.
I had some challenges along the way as well;
- My account got locked out for some reason – this was resolved reasonably quickly in about 24 hours as I recall though.
- My original kernel got corrupted to the point I could no longer edit it – this was never resolved; it took weeks to even get any initial feedback from Kaggle. Disappointing but ultimately forced me to break up my work into what probably became more consumable in the end, so a slightly positive result, although a frustrating experience.
- Due to the nature of their competitions, geospatial seems to be a rarely used feature; I wanted to do some spatial join functionality – although it was unavailable. I accomplished my task through a brute force workaround – months later my thread has no response from the Kaggle team however. You can see others encountered it as well. I believe I was the first to start using geospatial data in this way in the competition.
My Findings
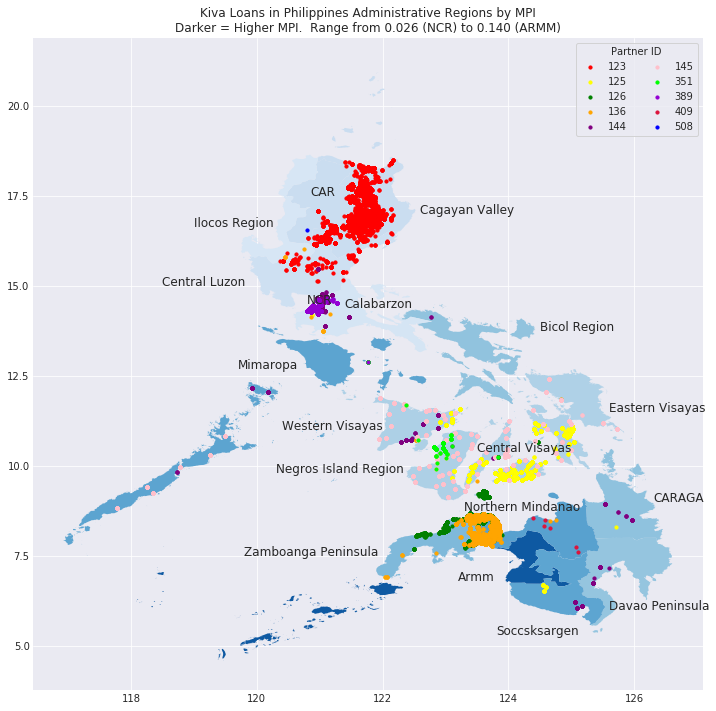
Some of the more interesting things I did with the data included trying to leverage metrics that Kiva – as a microfinance lender – could do something about; vs. using some of the metrics of multi-dimensional poverty that they could not. For example, Kiva can provide working capital for your business; however it cannot build roads to extend access to the market. Others found the geospatial points to be dirty, and provide more accurate lat/long coordinates with a Google API; although most all of these were simply used for visualization. Whether inaccurate points or inaccurate algo on top of them, I found a fair amount of regional data assignment to be poor; doing this myself, with the more accurate points, resulted in a better assignment of loans and data. This coupled with regional metrics more focused on financial metrics (such as consumption (spending) vs. a multi-dimensional poverty index) allowed for what I would argue were much better peer comparisons and understanding of where lending money was going in a region. Some of these datasets including much smaller/tighter regions as well. For example, Kenya’s 8 large regions could be analyzed at 47 much more local counties – providing much more accurate data to evaluate. I added a lot of datasets along the way.
My work ended up being broken out into 3 kernels as a result of the technical challenge, although I think this came out well. In chronological order they are:
- Kiva Exploration by a Kiva Lender and Python Newb – a my first Kaggle Kernel and EDA, exploring around.
- An Exploratory Look at Kiva *Lenders* – irrelevant for the competition goals, but something I worked on while hoping the first kernel got fixed; and I thought an interesting look into one of the datasets about the people actually doing the lending. I thought some things in here were pretty neat.
- Kiva Poverty Targeting – I tried to be succinct as I could in code and text, although as you can surely tell from this article already, I can be pretty verbose. Nonetheless my final submission with findings, as well as a lot of merged geospatial maps and poverty metrics I found for various countries. Kinda of a “here’s everything I found – take advantage of what you like” approach.
Winners Announced!
There ended up being a lot of great published model work near the end – I ended up taking 4th place, and being the only submission that did not contain any kind of model. I do think I produced a lot of valuable actionable results and ideas however. There’s a lot more in my kernel that was mentioned in the winner’s thread, and I encourage you to give the last one a read if it’s the only one you poke around. You can also explore the work of the other winners, as well as other/popular kernels here.
Not only was it a much more fun way to explore python than my homework, but it was awesome to be recognized for the work I put in, which came with a $1000 prize. Payment is done through a service called Payoneer, which I did recently collect. I’ll do more work on Kaggle in the future, but I really need to get back to my course and progress on through the modeling! I’ve been slow returning to it due to other aspects of life, although will be working through the next steps of my Udemy course soon, and would recommend it to anyone looking to play around and learn python as well. I’ll also note this was my first time really playing around with any geospatial data, and there was enough code/examples out there on the internet and stack overflow that I was able to do what I wanted to accomplish with it. Python is a great language with a huge community of libraries and resources available to help you accomplish a lot of different types of work, and I’ve enjoyed learning and using it a lot thus far.
Stay connected