

So, what are we talking about when using a model here? Most of the time in my career, well pretty much all of the time, when I’ve been talking about a model, it’s been a data model. The way data is structured and stored in a database. However under the modeling topic here, we’re talking about mathematical models. In this context we’re talking about mathematically modeling the behavior of something. In regards to the data world, often these are data models we use to try and predict future things based on those we have observed and learned from in the past. So what are some of the terms and components around these models?
Training Set – This is the set of data that will be used as input to a model. We want a representative set of all the data we have to be used for making the model, but we don’t want to use all of it; we’ll need some of that data to test the model later and see how well we did. We’ll test it with data it’s never seen before. If we train the model with *all* of our data, we also run the risk of overtraining the model. Maybe it will fit all of that data perfectly – but actually have much poorer predictions once it sees new data than it might have produced being constructed another way.
Mathematical Model – This is the set of math magic that’s going to actually create our predicted results. The training set will be data input to it, the model will use it as input to learn from and try to find a mathematical structure that fits it best. With data points plot on a graph this could be as simple as a straight linear line of best fit, such as in the data below for ice cream sales.
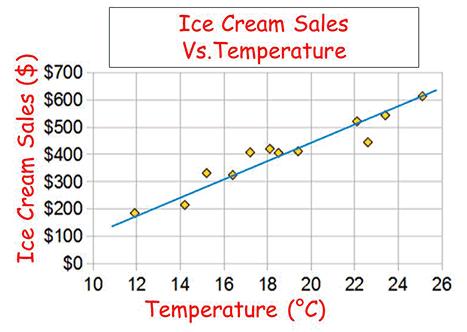
Is the line actually a good model? Well it is decent for this data so far, of course we all know at some point we will no longer be able to purchase ice cream as we spontaneously combust. More complicated lines and models can be drawn to fit the data, as is shown below from polynomials degree 1 to 5.
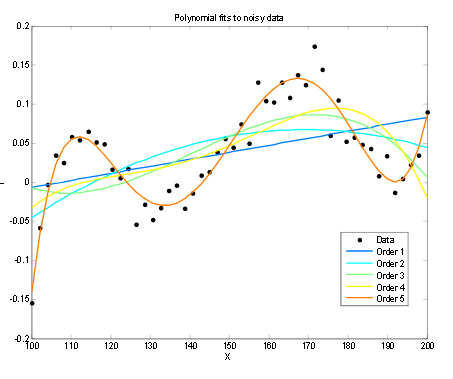
The more complicated the math here the better the line is fitting this specific set of data, and the better it might predict new data.
Test Set – This is a set of data that we held back and didn’t give the model, because we want to test how well it predicts outputs. So we may have split our available data randomly up into 80% for training and 20% for actual testing.
Lift – How well did our predictive model do? This is how well we did vs. a model that simply guessed completely at random. Perhaps an unsophisticated model achieves 10% lift above random. A PhD in stats and computer science may be able to take that model and squeeze (or remake) it to produce a lift of 30%. The term also fits in well with how this site was named, heyo!
Stay connected